# Usage Dashboard
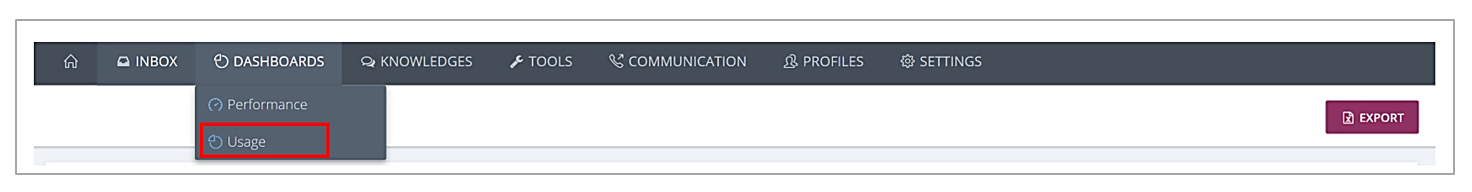
Click on “Dashboards” then "Usage" to get the usage report.
⚠️
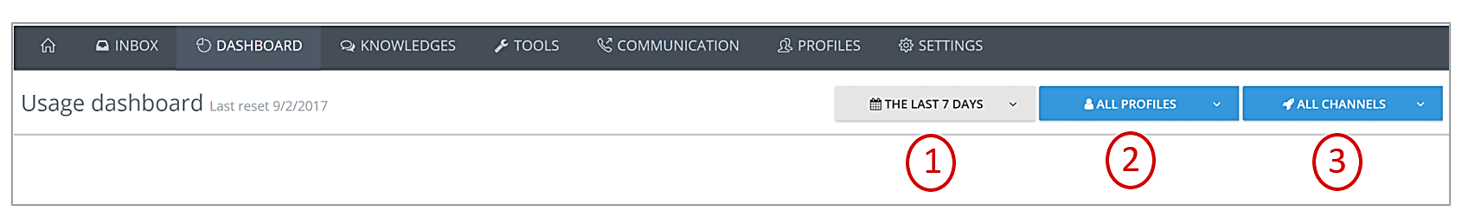
Choose the time period you want to display (Today, the last 7, 14, 30 days or the last 12 months) (1) by clicking on the filter at the top right. This will display the corresponding tiles.
⚠️
The usage report can be also filtered according to the existing profiles (2) but also according to the channels (3).
Profile or channel filtering only exists if there are several profiles and/or channels.
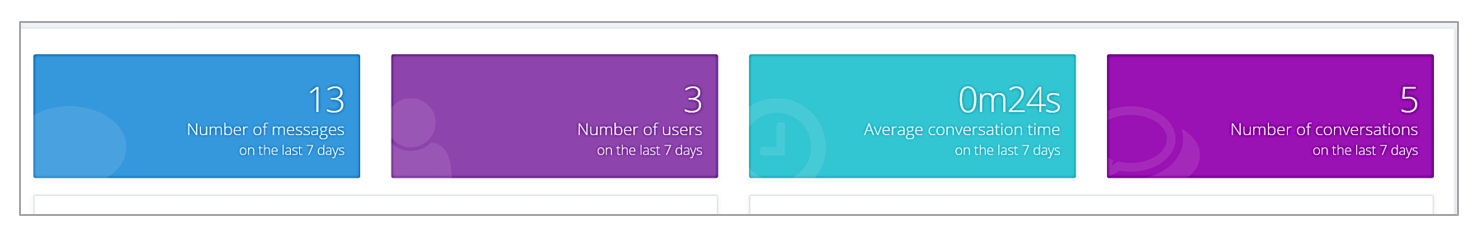
The " Usage " tab provides information about:
- Total number of messages: any type of message (chitchats and questions)
- Number of distinct users
- Average conversation time
- Total number of conversations
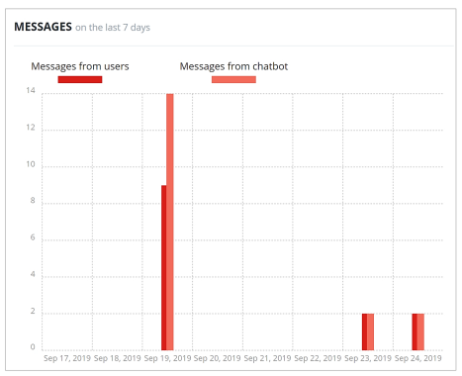
# Messages
This graph shows the number of messages from users and the number of messages from the chatbot over the selected period.
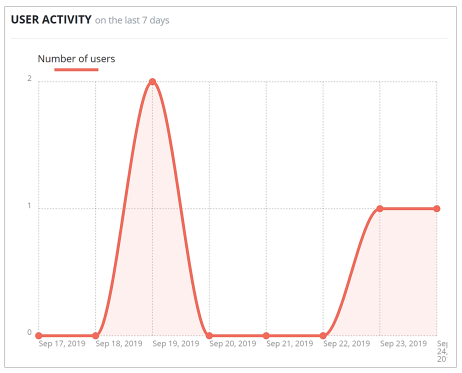
# User activity
This second graph shows the number of users over the chosen period.
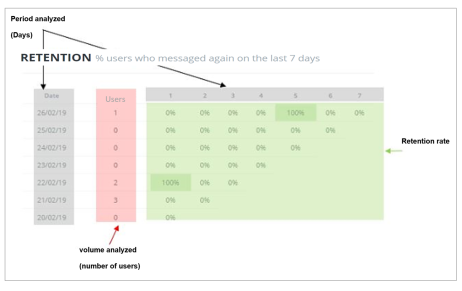
# Retention
In this dashboard there is also a retention graph that measures user engagement, that is to say the rate of usage over a given period of time.
The retention rate therefore corresponds to the proportion of users who come to talk to the chatbot on a specific day without taking into account any interactions the user may have had with the chatbot before that particular day. (Here, over a given period: the last 7 or 14 days).
In order to interpret a retention graph, it is necessary to understand that the temporal element, i.e. the period analyzed, is found both on the x-axis and the y-axis.
For instance: The 2 users who spoke to the Chatbot on 21/02/19 also requested it on 22/02/19 (Information: 100% in column 1).
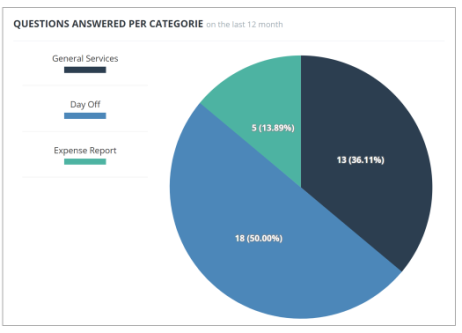
# Questions answered per categories
This graph shows the distribution of the questions answered by category over the chosen period.
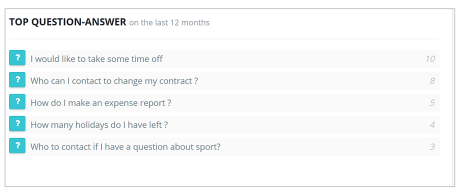
# TOP Question-Answer
This graph shows the ranking of the most frequently asked questions over the given period.
For example, the question "I would like to take some time off" was asked 10 times while the question "Who to contact if I have a question about sport?" was asked three times over the last 12 months.