# Performance dashboard
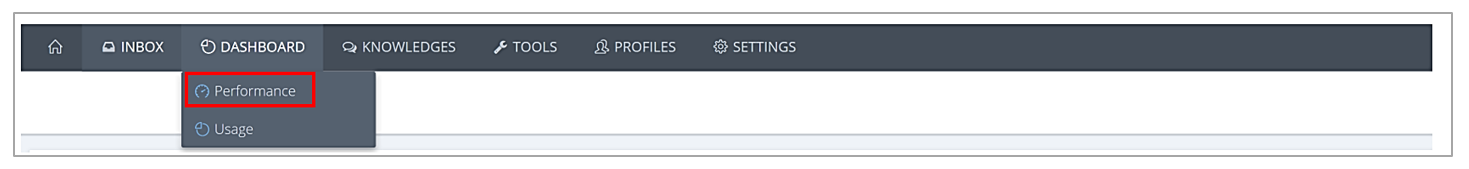
Click on “Dashboards” then "Performance" to get the performance report.
⚠️
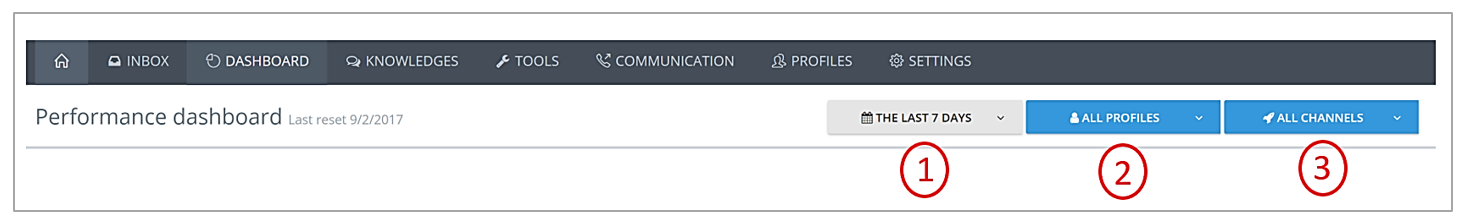
Choose the time period you want to display (Today, the last 7, 14, 30 days or the last 12 months) (1) by clicking on the filter at the top right. This will display the corresponding tiles.
⚠️
The performance report can be also filtered according to the existing profiles (2) but also according to the channels (3).
Profile or channel filtering only exists if there are several profiles and/or channels.
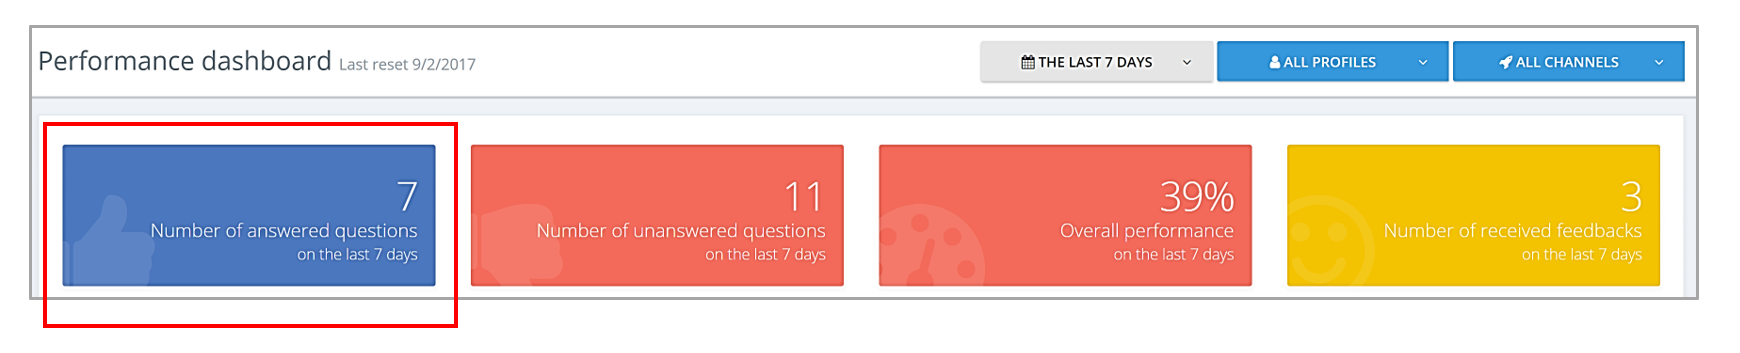
The "Performance" tab provides information about:
# The number of answered questions
The number of answers provided includes any type of response: direct and low score answers.
For example, as displayed above, over the last 7 days, the chatbot provided 7 answers.
# The number of unanswered questions
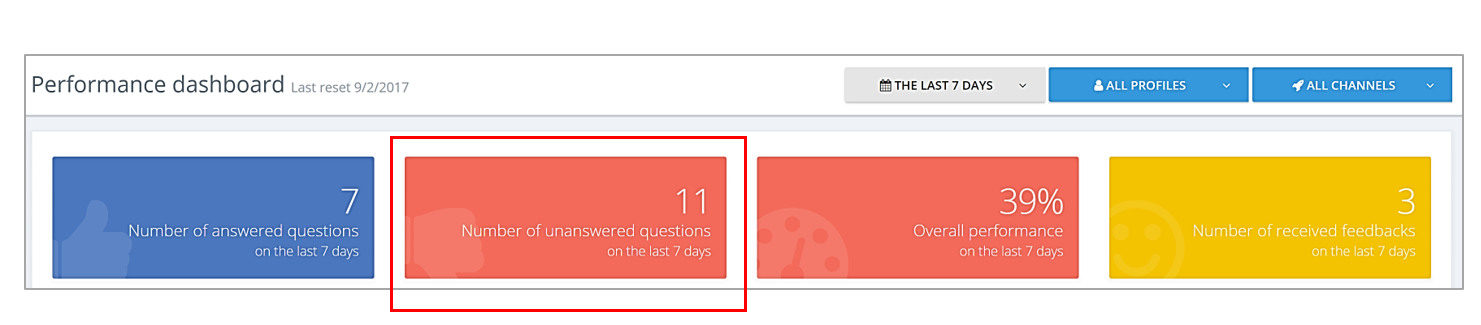
Here for instance, on the last 7 days, the chatbot could not answer 11 questions.
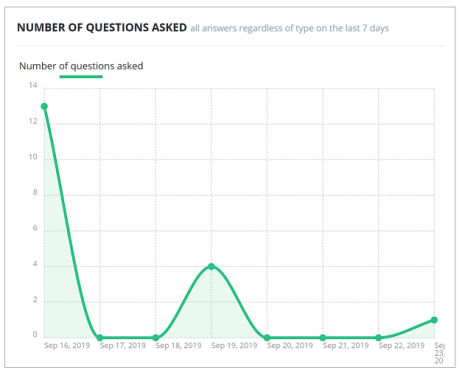
# The total number of questions asked
The following graph shows the evolution of the number of questions asked over the chosen period. For example, over the last seven days.
Overall performance
The overall performance indicates the percentage of questions answered over the chosen period.
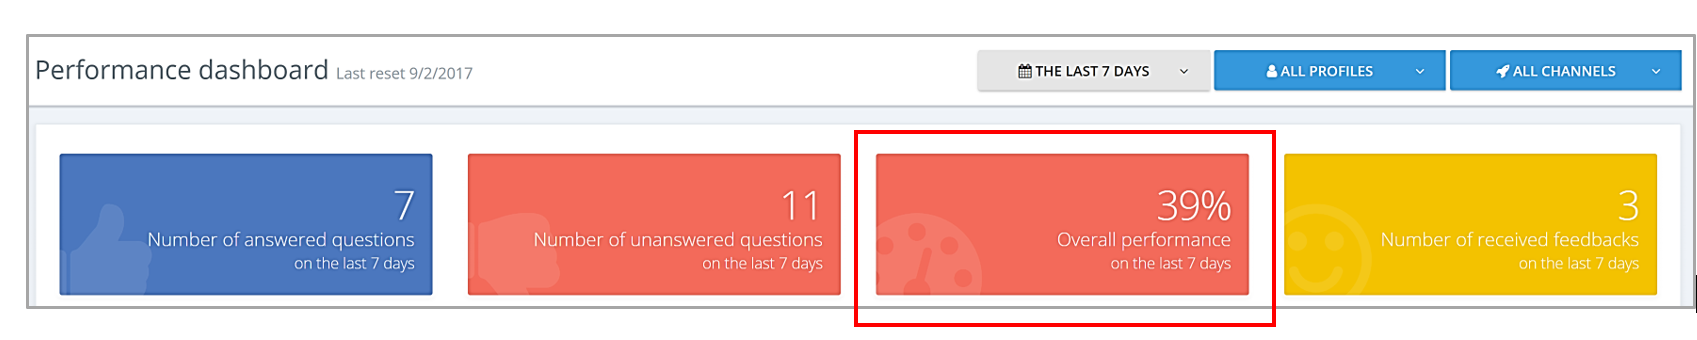
The percentage is calculated as follows:
the number of questions answered divided by the total number of questions asked (question answered + no answer + Low score).
Example: 7 Q answered/ (7 Q answered + 11 unanswered Q) = 0.389
Chatbot performance: 39%.
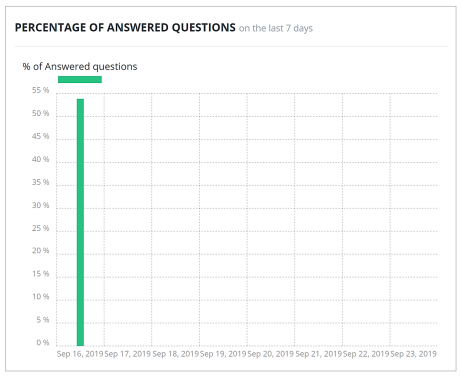
In addition to the tile (above) giving the overall performance over the last 7 days, the graphic "Percentage of questions answered" allows to evaluate the performance of the chatbot over the chosen period.
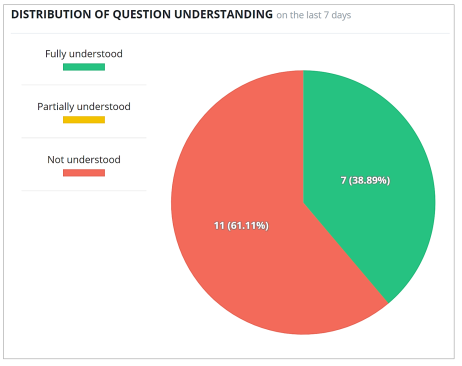
The graph below shows the distribution of the understanding of the question over the chosen period, in other words the percentage of questions that are perfectly understood or not understood.
For example, over the last 7 days, 7 questions were fully understood (38.89%) and 11 questions were not understood (61.11%) .
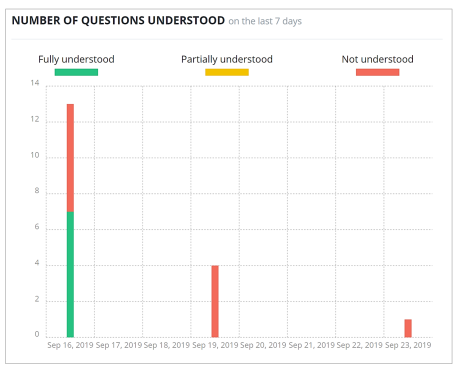
In addition, the following graph shows the precise number of questions understood for each day over a selected period (for example, over the last 7 days). Questions can be perfectly understood, partially understood or not understood.
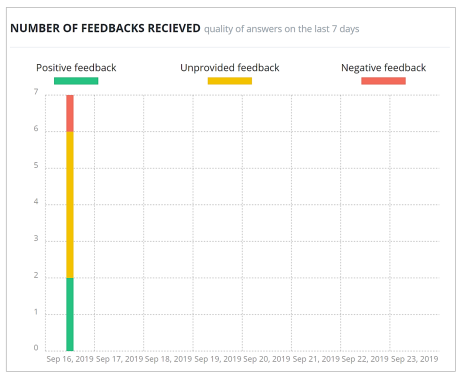
# The number of feedbacks received
The number of feedbacks received indicates when a user give a feedback ( negative, positive or ignored) over the selected period.
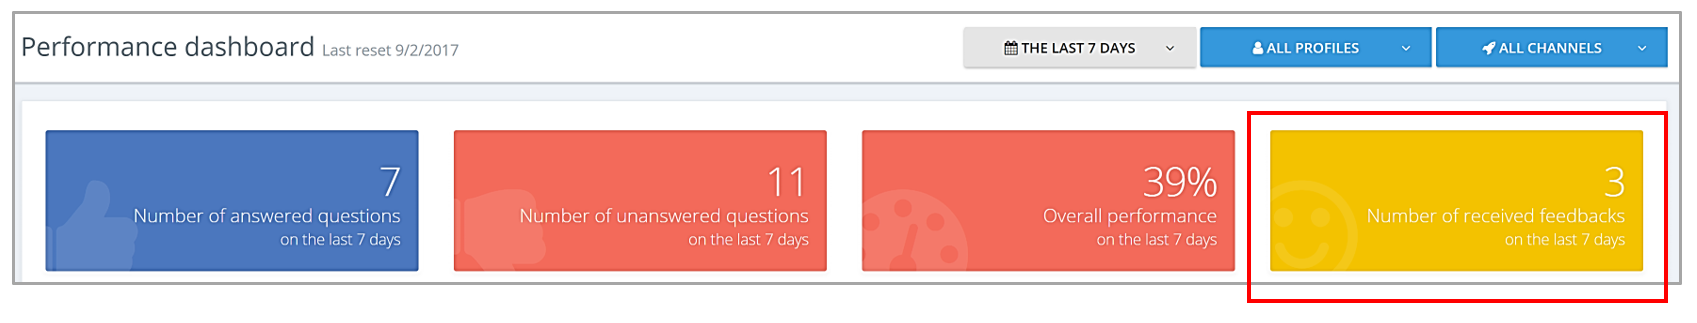
Here for example, out of 7 questions answered by the chatbot, users provided 3 feedbacks. There are therefore 4 feedbacks that have not been given by users.
For each answer given, the chatbot collects feedback from the user.
Feedback can be positive, negative or not given.
Calculation rule for ignored feedbacks:
Number of responses provided - number of feedbacks (negative + positive feedbacks) = number of ignored feedbacks.
For example: 7 responses provided - 3 feedback = 4 feedback not provided.
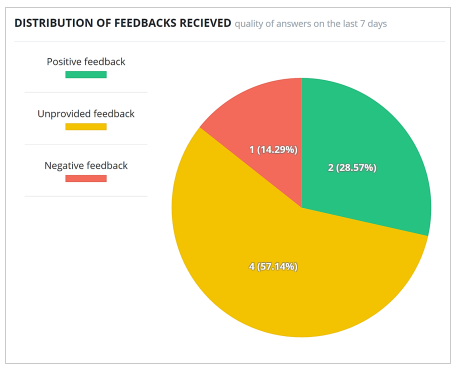
In addition, the following graphics show the percentage distribution of feedbacks, as well as the precise number of feedbacks for each day, over a selected period.
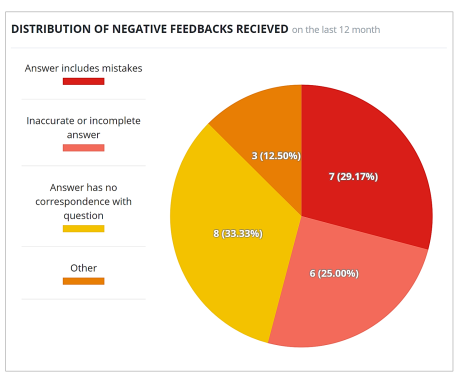
The user can provide negative feedback when:
the answer contains mistakes or is incomplete
it does not correspond to the question asked
for any another reason
For example, over the last 12 months, 7 answers contained mistakes (29.17%), 6 answers were incomplete (25.00%), 8 answers did not correspond to the question asked (33.33%) and 3 feedbacks without information (12.50%).